This demo uses Graphite and Grafana to store and present API metrics. The demo environment is installed on Ubuntu.
Graphite
Graphite has two major components.
The first is carbon-cache, which is a daemon process to receive metrics data from client through TCP connection and store into filesystem via whisper database library.
Another one is a webapp. It provides HTTP API for generating graphs and retrieving raw data.
Since Ubuntu 14.04, it’s easy to install graphite with apt-get:
1 | sudo apt-get update |
Both carbon and graphite-web are installed as python module.
Start carbon:
1 | sudo service carbon-cache start |
Graphite-web is base on django framework. Read /usr/share/doc/graphite-web/README for how to setup graphite-web. A major steps is to create database and default data:
1 | sudo graphite-manage syncdb |
For testing Graphite, you can start Graphite with the Django lightweight Web server for development:
1 | sudo -u _graphite /usr/bin/django-admin runserver --settings graphite.settings 0.0.0.0:8080 |
To install on Apache, follow the guide in /usr/share/doc/graphite-web/README.
1 | sudo apt-get install libapache2-mod-wsgi |
Graphite-web 0.9.12 only works under URL root path, it conflict with Apache default site setting. I modify /etc/apache2/sites-enabled/graphite-web.conf to make it work in a virtual host on port 81.
1 | Listen 81 |
Reference:
Grafana
Download grafana package and extract to a directory. Configure Apache web server to make the grafana directory accessable.
Edit config.js (copy from config.sample.js) to enable graphite as datasource.
Because graphite-web is hosting on virtual host on port 81, which is different than where grafana is hosting, there is cross site script access restriction. Have to enable CORS (cross origin resource sharing) on graphite-web side.
Enable Apache mod_headers:
1 | sudo a2enmod headers |
Add into /etc/apache2/sites-enabled/graphite-web.conf:
1 | Header set Access-Control-Allow-Origin "*" |
Elasticsearch
Elasticsearch is used by Granfan as a database to persistent dashboard configuration. Search and analystics features of Elasticsearch isn’t used in this case. Without Elasticsearch Grafana still works, but unable to save any change to dashboard design. You have to export dashboard JSON and import next time you want to use it.
1 | wget https://download.elasticsearch.org/elasticsearch/elasticsearch/elasticsearch-1.4.1.deb |
Elasticsearch is not starting on bootup by default. To setup as service, run:
1 | sudo update-rc.d elasticsearch defaults 95 10 |
To start manually, run:
1 | sudo /etc/init.d/elasticsearch start |
To enable CORS (cross origin resource sharing), add below into /etc/elasticsearch/elasticsearch.yml:
1 | http.cors.enabled: true |
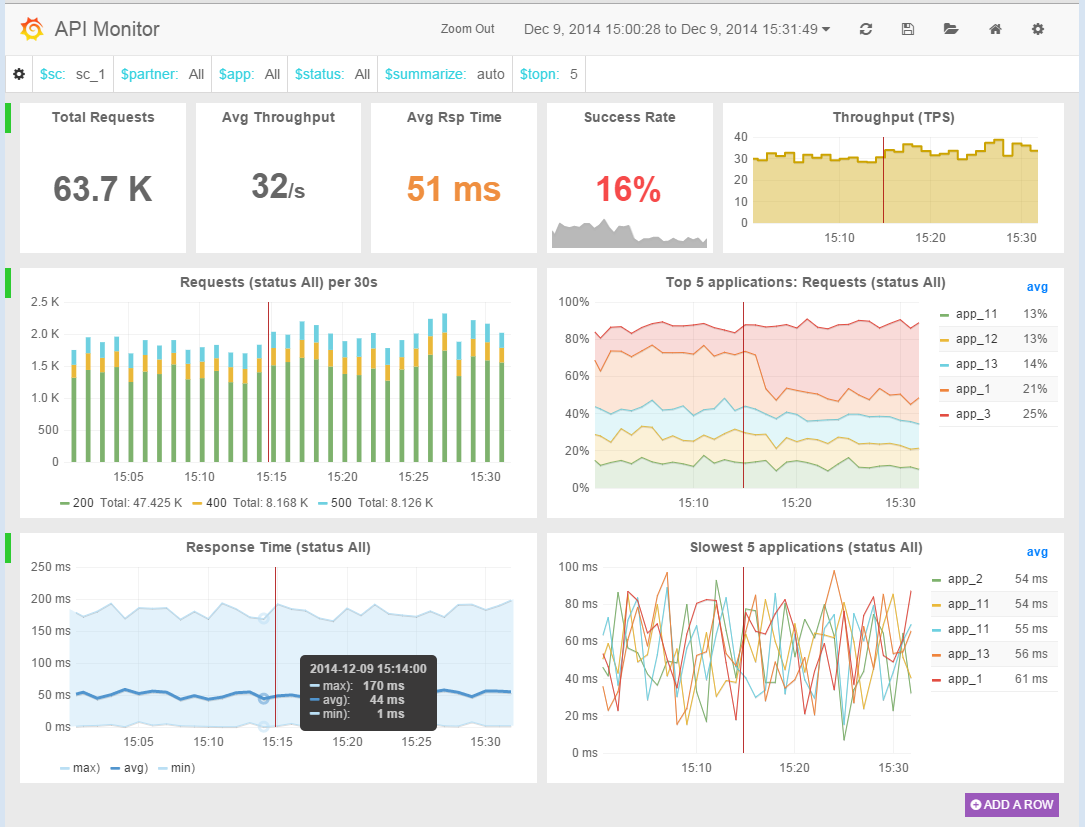
Demo
The scala script feed_graphite.scala generates mock API metrics data for demo. The Grafana portal is defined as api.json. Both files are stored in this gist.